How to Build a Customer Loyalty Survey That Prevents Churn
Most brands feel churn coming but never ask why. A well-designed customer loyalty survey flags at-risk customers 30–60 days before they leave — covering NPS, CSAT, and CES, question design, and how to turn feedback into retention action.
Updated
Summarize this post with AI
Customer loyalty is when buyers repeatedly choose your brand over alternatives. Not from habit, but from genuine preference. It shows up in repeat purchases, referrals, and a willingness to pay more even when cheaper options exist.
Yet most brands feel churn creeping in and can't pinpoint why. They assume they know what customers think without actually asking. That gap between assumption and reality? It's where revenue disappears.
The real problem: acquiring new customers costs significantly more than keeping existing ones. Harvard Business Review and McKinsey research consistently confirm that retention economics favor brands that invest in keeping the customers they already have. Still, most businesses never survey their customers for early warning signs of defection.
A strategic customer loyalty survey changes that equation. When designed correctly, surveys identify at-risk customers 30 to 60 days before they leave. That window is everything.
This guide walks through the three metrics that matter (NPS, CSAT, CES), when to survey without creating fatigue, how to build customer loyalty questions that reveal the real "why" behind dissatisfaction, and most importantly, how to turn survey insights into retention actions your loyalty program can activate.
Why Your Customer Loyalty Survey Matters (And What Most Brands Get Wrong)
The Business Case for Loyalty Surveys
Most brands already know retention matters. But few connect a well-designed customer loyalty survey to three business outcomes that go beyond churn prevention.
Higher lifetime value. Loyal customers spend more per order and buy more frequently over time. Bain & Company research shows even a modest bump in customer retention rates can produce outsized gains in profitability. Surveys tell you exactly which customers are trending toward loyalty and which are drifting away, so you can focus resources where they'll generate the most return.
Referral engine. Promoters (customers who score 9 or 10 on NPS) drive word-of-mouth recommendations. That makes them your cheapest and most credible acquisition channel. A customer loyalty survey identifies these advocates so you can activate them through referral programs and exclusive rewards.
Easier upsell and cross-sell. Customers who trust your brand accept new product offers more readily. When surveys confirm that trust level, you can confidently introduce higher-value offers without risking the relationship.
Beyond these three outcomes, there's a more urgent reason to survey: catching churn before it happens. Bain & Company's NPS research found that Passives (those scoring 7 or 8) defect at roughly twice the rate of Promoters. They look satisfied on the surface, but they're one competitor offer away from leaving. A customer loyalty survey is the only way to spot them in time.
Detractors, Passives, and Promoters: The Three Segments That Matter
Before you build any survey, you need to understand the three segments your responses will fall into. These categories, originally defined through Bain & Company's Net Promoter System research, form the foundation of every loyalty measurement strategy.
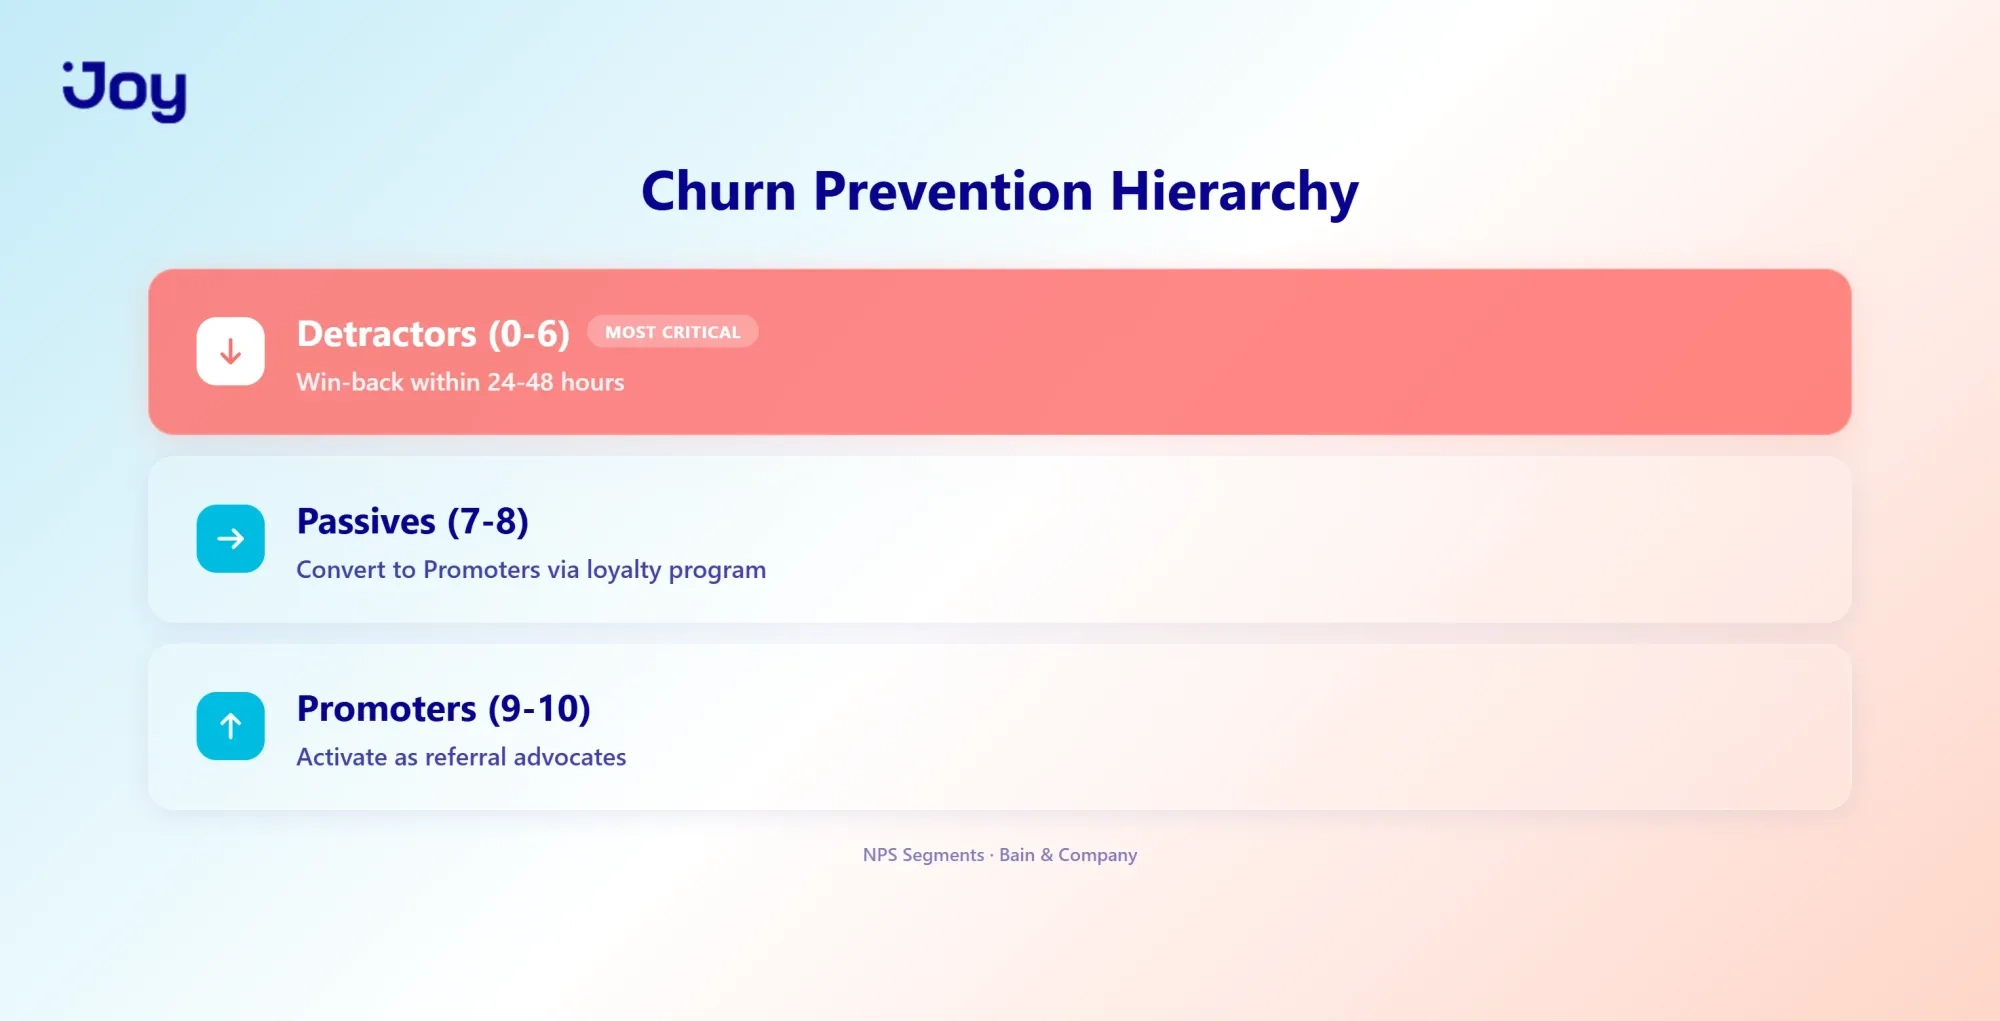
Promoters (9 to 10) are your true advocates. Lowest churn rates, highest lifetime value, and they actively refer new customers. Your goal with this group is simple: keep them engaged and give them reasons to spread the word.
Passives (7 to 8) are the segment most brands overlook. They're satisfied enough that they don't complain, but they're not emotionally invested in your brand. That makes them vulnerable to competitor offers, price changes, or even a slightly better experience elsewhere. These are your "silent defectors," and converting them represents the single biggest opportunity in your loyalty strategy.
Detractors (0 to 6) are actively at risk. They've had negative experiences and, left unaddressed, they will leave. Some will share their dissatisfaction publicly. Immediate intervention is critical with this group.
The Three Metrics Every Customer Loyalty Survey Must Track
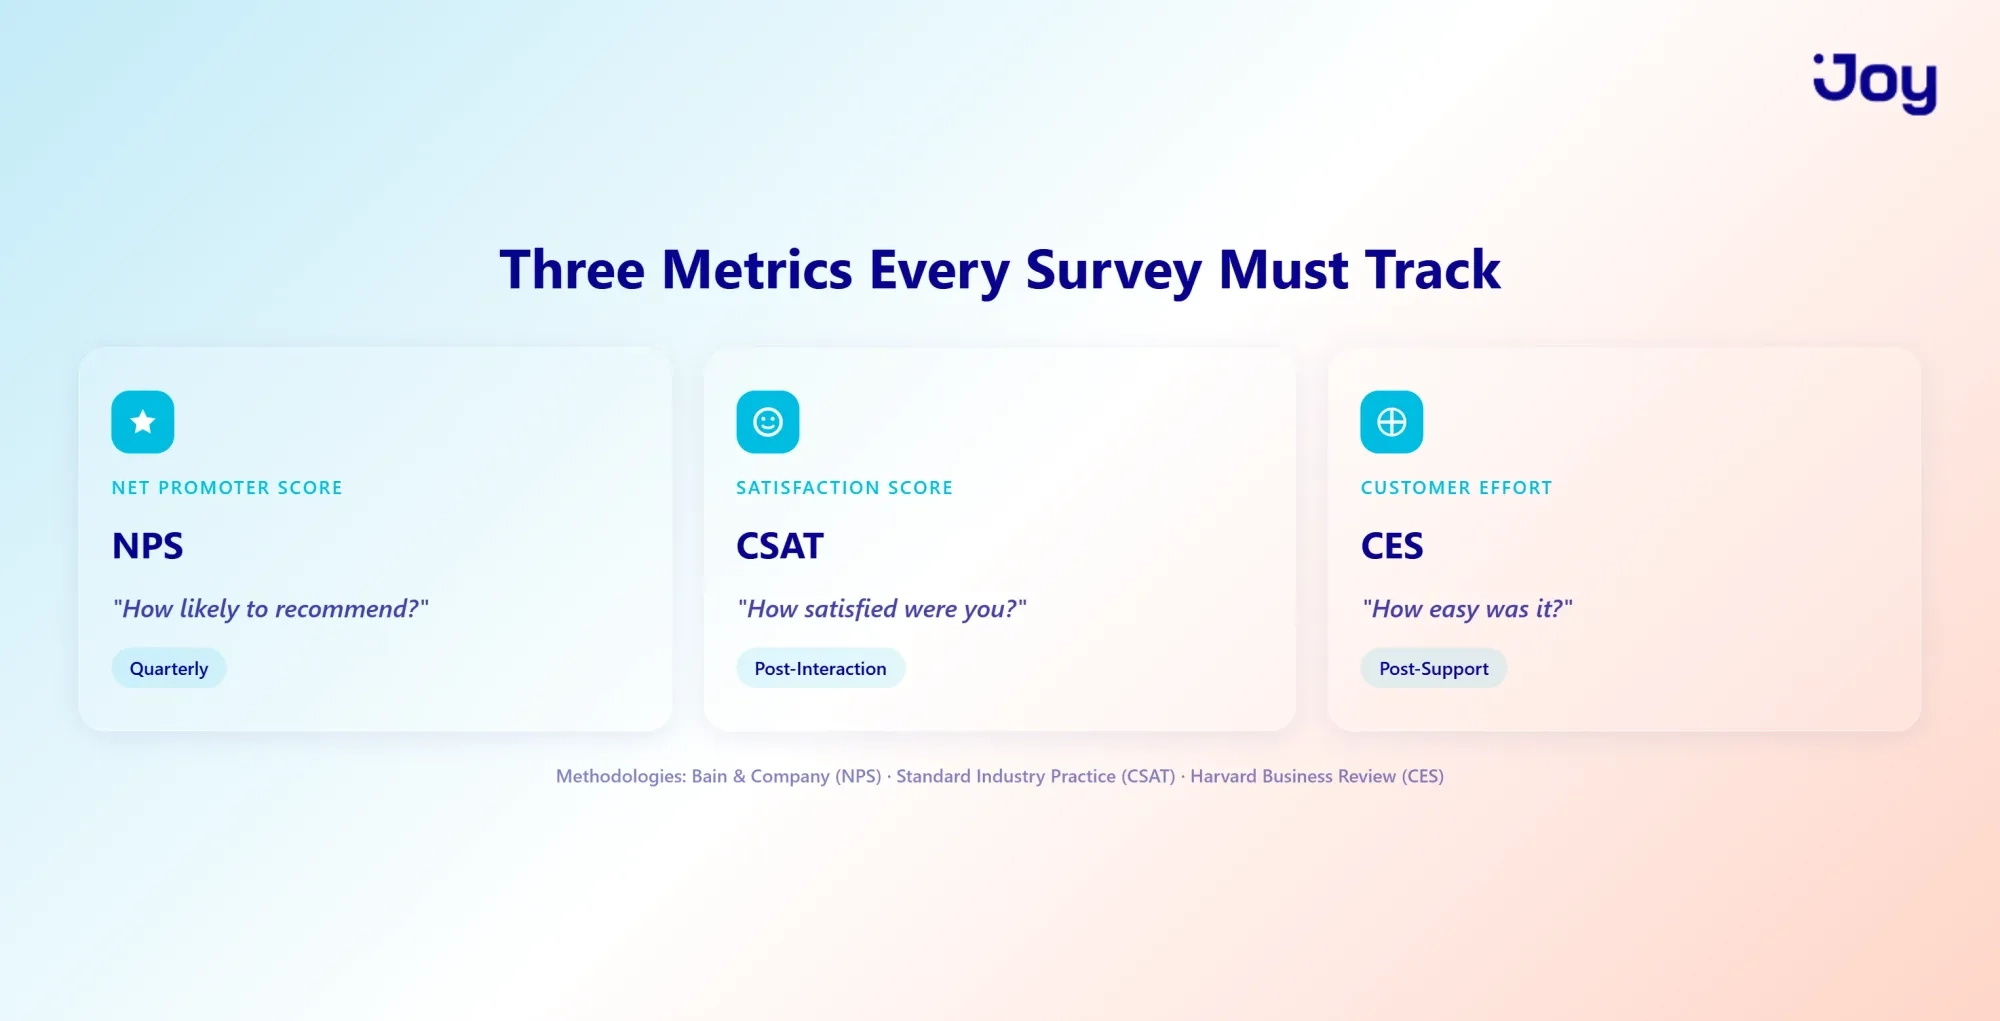
Three proven metrics form the backbone of any effective customer loyalty questionnaire. Each one reveals a different dimension of loyalty.
Net Promoter Score (NPS): The Gold Standard for Measuring Loyalty
NPS is built on a single question: "How likely are you to recommend us to a friend or colleague" Respondents answer on a scale from 0 to 10.
The formula is straightforward. Take the percentage of Promoters (scores 9 to 10), subtract the percentage of Detractors (scores 0 to 6). The result is your NPS, ranging from negative 100 to positive 100. Fred Reichheld developed this methodology at Bain & Company, and it's become the most widely adopted loyalty metric across industries.
What makes NPS particularly valuable for churn prevention? Its predictive power. A declining NPS signals trouble before it shows up in your revenue numbers. And tracking how individual customers move between segments over time reveals exactly who's becoming more loyal and who's drifting toward defection.
For effective churn detection, survey your entire customer base quarterly and watch for two patterns: Passives trending downward toward Detractor territory, and former Promoters sliding into the Passive range. Both are early warning signals that demand action.
CSAT (Customer Satisfaction): Measuring the Moment
While NPS captures overall loyalty sentiment, Customer Satisfaction Score (CSAT) zooms in on specific interactions. The core question: "How satisfied were you with [specific experience]" Respondents typically answer on a 1 to 5 or 1 to 7 scale.
The formula is equally simple: divide the number of satisfied responses (typically 4 and 5 on a 5-point scale) by total responses, then multiply by 100.
CSAT works best when deployed immediately after key touchpoints. Send it within 72 hours of a purchase, within 24 hours of a support interaction, or right after a return or exchange. This timing captures honest, contextual feedback that broad surveys miss.
For churn prevention, CSAT identifies friction points where customers lose confidence in your brand. A customer might still be an overall Promoter but have a terrible support experience that starts eroding loyalty. CSAT catches that erosion at the moment it happens.
Customer Effort Score (CES): The Friction Detector
CES measures something most brands overlook entirely: how much effort a customer had to exert. The question is simple: "How easy was it to [resolve your issue / complete your purchase]" Respondents answer on a 1 to 5 scale.
Research published in Harvard Business Review ("Stop Trying to Delight Your Customers") found that reducing customer effort is a stronger predictor of loyalty than exceeding expectations. High-effort experiences drive defection more reliably than low-satisfaction ones. That's a counterintuitive finding worth sitting with.
Deploy CES after support interactions, after checkout, and after any process that requires multiple steps from the customer. When CES scores drop, you've found a friction point that's actively pushing customers away.
How to Choose: NPS vs. CSAT vs. CES
Each metric serves a distinct purpose. The most effective customer loyalty survey uses all three together rather than relying on just one.
NPS is your overall loyalty signal. Deploy it quarterly or biannually across your full customer base. It tells you the big picture: are customers becoming more loyal or less loyal over time?
CSAT tracks specific touchpoint satisfaction. Deploy it after every major interaction (purchase, support, return). It tells you where your experience is strong and where it's falling apart.
CES measures friction and effort. Deploy it when a customer contacts support or navigates a complex process. It tells you what's making customers work too hard.
The common mistake is picking just one. NPS alone won't tell you why customers are unhappy. CSAT alone won't tell you whether they'll leave. CES alone won't tell you if the effort matters enough to drive defection. Together, they create a complete picture: CSAT and CES pain points feed into NPS decline, which feeds into churn.
When you combine these three metrics with your loyalty program analytics, you can trace the entire journey from a single bad experience to a lost customer and intervene at the right moment.
When and How Often to Survey Without Causing Survey Fatigue
Get the timing and frequency wrong, and you'll either overwhelm customers or miss critical feedback windows. Both outcomes damage the data quality your customer loyalty questionnaire depends on.
The Survey Fatigue Problem (And Why Cadence Matters)
Survey fatigue is real and measurable. When customers receive too many surveys, response rates drop, answer quality deteriorates, and some customers start resenting the brand entirely. Worse data and a worse customer experience, at the same time.
The sweet spot for most businesses: three to four surveys per customer per year. That keeps feedback flowing without turning your brand into the company that never stops asking questions.
What many brands miss: your loyalty program data already reduces survey dependency. Points activity, tier status, redemption patterns, and purchase frequency all provide behavioral signals about engagement and satisfaction. Combine those behavioral indicators with targeted surveys, and you can ask fewer questions while still getting a more complete picture of customer loyalty.
Trigger-Based Surveys (Interaction-Driven)
Trigger-based surveys fire after specific customer moments, and they consistently produce higher response rates and more honest feedback than scheduled surveys. The reason is simple: the experience is still fresh.
Here are the key trigger points to build into your survey cadence:
Post-purchase (within 72 hours). Send a CSAT question about the buying experience. This captures satisfaction while the purchase memory is vivid and the customer is still in a positive mindset.
Post-support (within 24 hours). Send a CES question about how easy it was to resolve their issue. Support interactions are high-emotion moments, and friction here drives churn faster than almost anything else.
Post-return or refund. Send a short survey to identify whether the customer is a Detractor. Returns are a critical inflection point where loyalty either recovers or collapses.
Your loyalty program creates additional natural trigger points. When a customer reaches a new VIP tier, redeems a reward, or hits a points milestone, that's an ideal moment to ask a quick satisfaction question. These loyalty-event surveys feel relevant rather than intrusive because they're tied to something the customer just accomplished.
Periodic Surveys (Scheduled Check-Ins)
Alongside trigger-based surveys, schedule periodic NPS check-ins to capture overall loyalty trends. The most effective cadence depends on your customer segments.
For high-value customers, survey quarterly. These are the customers whose loyalty matters most to your bottom line, and you need to catch any sentiment shifts early.
For standard segments, survey biannually. Enough data points to spot trends without creating fatigue.
One practical tip: split your customer list so you're surveying roughly 50% per cycle. This prevents the same customers from receiving surveys back to back and keeps your data fresh across different time periods.
Survey Frequency by Business Type
Purchase frequency should directly shape your survey cadence. The more often customers buy, the more touchpoints you have and the more data you already collect passively.
High-frequency businesses (weekly purchases, like coffee or groceries): Limit to monthly NPS surveys plus trigger-based surveys after support interactions only. Daily purchase data already tells you a lot.
Mid-frequency businesses (monthly purchases, like apparel or beauty): Quarterly NPS surveys plus trigger-based surveys after purchases and support interactions.
Low-frequency businesses (quarterly or less, like furniture or electronics): Biannual NPS surveys plus trigger-based surveys after every purchase and support interaction. Each touchpoint is precious, so capture feedback from all of them.
The principle: more frequent purchases mean less frequent surveys, because behavioral data fills the gaps. Less frequent purchases mean more frequent surveys, because each interaction carries more weight.
Building Your Customer Loyalty Questionnaire: Getting Honest Answers
The way you structure your customer loyalty questions determines whether you get surface-level responses or genuine insights that actually predict churn.
The Anatomy of a Great Customer Loyalty Question
Every effective loyalty question follows two rules.
Rule 1: Keep the core metric question simple and unambiguous. One question should measure one thing. Compare these two approaches:
Good: "How likely are you to recommend us to a friend" (0 to 10 scale)
Bad: "How would you rate our product quality and customer service" (This forces the respondent to average two different opinions into one answer, and you lose the signal from both.)
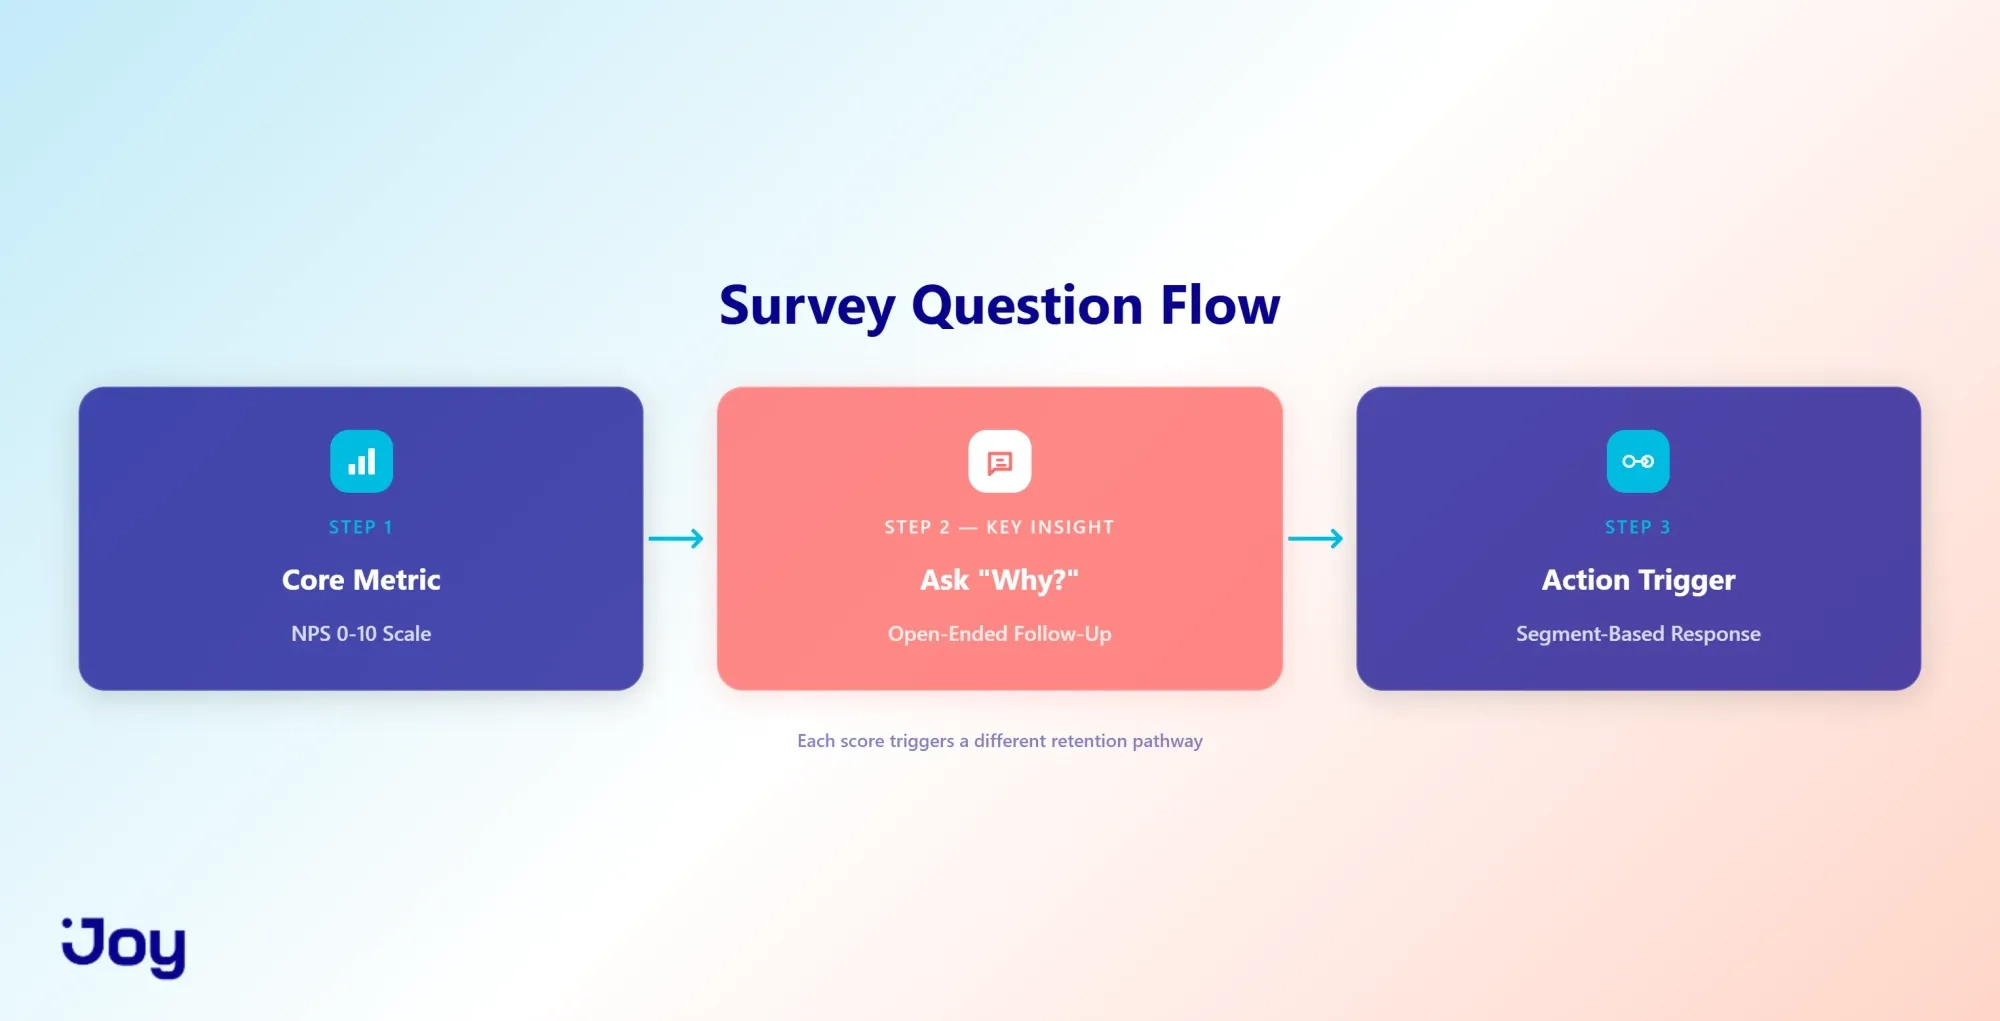
Rule 2: Follow up with an open-ended "Why" The metric question tells you where customers stand. The follow-up tells you what's driving that score. Without it, you have data but no direction.
Tailor your follow-up based on the score:
For Detractors (0 to 6): "What's the main reason you wouldn't recommend us"
For Passives (7 to 8): "What would need to change for you to rate us higher"
For Promoters (9 to 10): "What do you value most about buying from us"
These conditional follow-ups are where churn prevention actually begins. A Detractor telling you "shipping took 12 days" is infinitely more actionable than a number on a scale.
15 Customer Loyalty Survey Questions You Can Use Today
Here are 15 ready-to-use customer loyalty questions organized by category. Each includes the metric it serves and the recommended timing.
NPS and Overall Loyalty
- "How likely are you to recommend [brand] to a friend" (NPS core, quarterly)
- "If [brand] were no longer available, how disappointed would you be" (Loyalty depth, biannual)
- "How likely are you to continue purchasing from us over the next 12 months" (Retention intent, quarterly)
Satisfaction and Experience
- "How satisfied were you with your most recent purchase" (CSAT, post-purchase)
- "How would you rate the value you receive for the price you pay" (Value perception, quarterly)
- "How satisfied are you with our response time when you need assistance" (Support CSAT, post-support)
- "How well does [brand] meet your expectations compared to when you first started buying from us" (Expectation gap, biannual)
Effort and Friction
- "How easy was it to resolve your issue today" (CES core, post-support)
- "How easy is it to find what you're looking for on our website" (Navigation CES, post-browse)
- "How easy was the checkout process" (Checkout CES, post-purchase)
Loyalty Program Specific
- "How satisfied are you with the rewards available to you" (Program CSAT, quarterly)
- "How easy is it to earn and redeem your loyalty points" (Program CES, quarterly)
- "Which reward would motivate you to shop with us more often" (Open-ended, biannual)
Open-Ended Follow-Ups
- "What's the one thing we could improve to make you more loyal" (Churn driver, any)
- "What almost made you stop buying from us" (Churn near-miss, biannual)
That last question is particularly powerful. It surfaces friction and complaints that customers resolved on their own but still remember. Those near-miss moments are churn risks hiding in plain sight.
Mixing Question Types for Better Data
A strong questionnaire about customer loyalty combines three question types, each serving a different purpose.
Likert scales (1 to 5 or 0 to 10) give you quantifiable data that's easy to trend over time. Use these for your core metrics.
Multiple-choice questions are faster to answer and help with segmentation. Use them when you need to categorize responses (for example, "Which of these best describes your reason for contacting support").
Open-ended questions reveal the "why" behind the numbers. They surface unexpected churn drivers that you'd never think to ask about in a structured format.
The best practice: lead with one quantitative question, then follow with one open-ended question. Keeps the survey short while giving you both the score and the story.
Mobile-First Design and Survey Length
Keep your survey to five minutes maximum. That means three to five core questions plus one optional open-ended response. Format each question on its own screen for mobile devices, and avoid long grids, excessive dropdowns, or dense text blocks.
Shorter surveys consistently produce higher completion rates and better data quality. If you find yourself adding a seventh or eighth question, you're trying to cover too much in a single survey. Split it into two surveys deployed at different trigger points instead.
Incentivizing Responses (Without Bias)
Low-engagement customers are the hardest to survey, yet their feedback is often the most valuable for churn prevention. So how do you increase response rates without distorting your data?
Loyalty points or a small discount code for completing the survey work well for most segments. Tie the reward to your existing points program so it reinforces engagement rather than feeling transactional.
Tiered incentives encourage deeper responses. Offer a base reward for completing the survey and a bonus for providing an open-ended answer.
Prize draws attract broader participation without guaranteeing a reward to every respondent, which reduces the risk of incentive-driven "junk" responses.
One caution: keep incentives modest. Overly generous rewards attract respondents who care about the reward rather than the questions, and that degrades data quality.
Identifying Your At-Risk Customers (The Churn Signal)
Reading Your NPS Data for Churn Signals
Each NPS segment requires a different response, and the urgency differs dramatically.
Promoters (9 to 10): Safe for now. Your focus should be retention and referral activation. Give them reasons to stay and tools to spread the word, like referral bonuses or exclusive early access.
Passives (7 to 8): Your alert zone. A Passive customer isn't complaining, but they're not committed either. When you see a Passive trending downward across multiple surveys, that's a red flag demanding proactive intervention before they silently defect.
Detractors (0 to 6): Emergency zone. These customers are actively unhappy and ready to leave. Some already have one foot out the door. Immediate, personal outreach is the only response that has a chance of turning this around.
But the most valuable signal isn't any single score. It's the direction of change. A Promoter who drops to Passive between two surveys is a bigger concern than a customer who's been a stable Passive for a year. Track movement between segments over time, not just the numbers themselves.
Behavioral Patterns That Predict Defection
Survey data becomes even more powerful when you combine it with behavioral signals from your loyalty program. Several patterns reliably predict defection 30 to 60 days in advance:
A declining NPS combined with decreasing purchase frequency signals imminent churn. The customer is both less satisfied and less engaged. That combination rarely reverses on its own.
High CSAT but declining NPS reveals a Passive customer who likes individual interactions but is losing overall brand affinity. A competitor with a slightly better value proposition will win them over.
High CES combined with low NPS points to support friction as the primary churn driver. These customers are working too hard to get problems solved, and they're running out of patience.
Declining engagement with your loyalty program alongside a low NPS is the strongest churn signal of all. When a customer stops earning points, stops redeeming rewards, and scores low on surveys, they've mentally moved on. You're looking at a ghost customer.
Segmenting Your At-Risk Customers for Action
Not all at-risk customers deserve the same level of intervention. Segment them by both urgency and potential return on investment.
Segment 1: Passive high-value customers. Your biggest conversion opportunity. They spend significant amounts, they're satisfied enough to stay for now, and converting them to Promoters generates substantial lifetime value.
Segment 2: Recent Promoter-to-Passive drops. These customers recently loved your brand and something changed. Catching them early, while the positive relationship memory is still fresh, gives you the highest win-back probability.
Segment 3: Detractors with low switching cost. Be honest with yourself about this group. If a Detractor can easily switch to a competitor and has shown no response to outreach, allocating heavy resources to them may not be worthwhile. Focus on understanding why they're leaving so you can prevent similar losses.
Segment 4: Passive new customers. They haven't built loyalty habits yet. If their early experiences are mediocre, they'll churn before you ever had a chance to retain them. Intervene early with onboarding touches and first-purchase follow-ups to build connection before indifference sets in. (For a deeper look at ecommerce customer retention strategies beyond surveys, that guide covers the full tactical playbook.)
Closing the Loop: From Survey Feedback to Actual Churn Prevention
This is where most customer loyalty survey programs collapse. Brands invest in survey design, achieve decent response rates, collect useful data, and then do absolutely nothing with it. The survey itself doesn't prevent churn. The response does.
Closing the loop means taking specific, timely action based on what each customer told you. Here's how to build that feedback-to-action pipeline for each NPS segment.
The Detractor Win-Back Playbook (NPS 0 to 6)
Detractors require immediate, personal intervention. Automated responses won't work here because these customers feel unheard, and a templated email confirms that feeling.
Within 24 to 48 hours: A real person from your customer success team reaches out directly. Not a form letter. A message that references the specific complaint from their survey response. Acknowledge what went wrong, offer a concrete fix or compensation, and ask one question: "What would it take to keep your business"
Within two to three weeks: Follow up with a specific solution to their problem. Ask whether the fix resolved their concern and whether they're willing to give you another chance. Then re-survey them to track whether their NPS improved.
Long-term assessment: If a Detractor shows no improvement after two intervention cycles, accept the loss and redirect resources to Passives where the return on effort is higher. Not every customer can be saved. Recognizing that early prevents wasted investment.
The key principle throughout: specificity. Generic "we value your feedback" messages achieve nothing. Referencing the exact issue the customer raised demonstrates that you actually read their response and care enough to act on it.
Converting Passives to Promoters (NPS 7 to 8)
Passives represent the highest-ROI segment for loyalty investment because they're already satisfied. They just aren't committed. The gap between Passive and Promoter is usually one or two specific friction points, and your open-ended survey responses will tell you exactly what those are.
Start by categorizing the reasons Passives give for not being Promoters. The answers typically cluster into four categories:
Price sensitivity. They like your product but feel the value doesn't fully justify the cost. Address this with loyalty discounts, tier-based benefits, or exclusive member pricing that rewards continued patronage.
Product gaps. They want something you don't currently offer. Share these insights with your product team and, when possible, give Passives early access to new features or products that address their specific request.
Support friction. A frustrating support experience colored their overall perception. Consider offering VIP support access for at-risk customers, where faster response times and dedicated representatives rebuild confidence.
Competitor awareness. They know alternatives exist and they're keeping options open. Counter this with exclusive perks they can't get elsewhere: unique rewards, members-only events, or first access to limited products.
Your loyalty program's tier structure becomes your primary tool for converting Passives. Invite them to the next tier with a personalized challenge or goal. Create an engagement target that feels achievable and rewarding. When Passives see tangible progress toward something valuable, commitment follows.
Scaling Learnings: Systemic Changes from Survey Feedback
Individual responses drive individual interventions. But when 20% or more of your Detractors cite the same issue, you're looking at a systemic problem that requires a structural fix, not a one-off conversation.
Track the themes that emerge from open-ended responses and quantify their frequency. Common systemic issues include:
High checkout friction causing cart abandonment. Simplify your checkout flow based on the specific friction points customers identify.
Support responsiveness that consistently disappoints. Add capacity, create self-service resources, or introduce tiered support levels based on customer value.
Product gaps that multiple customers mention. Prioritize these in your product roadmap and communicate progress back to the customers who raised them.
Price sensitivity across a segment. Restructure your loyalty discount tiers to provide more visible value at key spending thresholds.
The systemic improvement cycle follows a clear pattern: survey reveals theme, you make a structural change, you communicate that change to affected customers, and you re-measure to confirm it worked. This closes the loop at the organizational level, not just the individual level.
Automation and Personalization: Close the Loop at Scale
Manual follow-up works for your first 50 survey responses. Beyond that, you need automation rules that route responses to the right action without human bottlenecks.
Build these three automation pathways based on NPS score:
NPS 9 to 10 (Promoters): Automatically send a referral program invitation with bonus points. These customers are already advocates. Give them the tools and incentive to act on that advocacy.
NPS 7 to 8 (Passives): Trigger a personalized email with a tier upgrade offer or exclusive benefit. Reference their survey response when possible. "You mentioned wanting more value from your rewards. Here's early access to our new tier benefits."
NPS 0 to 6 (Detractors): Flag for manual outreach by your customer success team and automatically apply recovery points or a service credit. The automation handles the logistics; the human handles the relationship.
Personalization is non-negotiable here. Reference the customer's specific feedback in every outreach. Offer solutions matched to their stated reason for dissatisfaction, not a generic discount. And respond within 24 hours. Speed communicates that their feedback actually matters.
Customer Loyalty Survey Best Practices Checklist
Before you launch your next survey, run through this checklist to make sure every element is in place. Missing even one of these steps can undermine the entire effort.
Before You Launch Your Survey
- Define your primary goal: churn prevention, satisfaction measurement, effort reduction, or all three
- Choose your metrics: NPS plus CSAT plus CES, or a subset based on your immediate priorities
- Determine your cadence: trigger-based, periodic, or a hybrid approach
- Set your sample size: all customers, or stratified by segment and value tier
- Plan your automation: map each possible response to a specific follow-up action
- Identify owners: who is responsible for following up with Detractors within 48 hours?
- Connect to your loyalty program: set up analytics to track NPS trends alongside points activity, tier movement, and redemption patterns
After You Collect Responses
- Segment responses by NPS bucket: Promoters, Passives, and Detractors
- Identify recurring themes in open-ended feedback
- Prioritize by impact: combine churn risk with the frequency of each complaint
- Assign clear owners: Detractors go to customer success, Passives go to your loyalty team
- Set response timelines: Detractors within 24 to 48 hours, Passives within one to two weeks
- Measure improvement: re-survey affected customers after 60 days to track movement
- Review loyalty program performance: did the changes you made based on survey feedback improve retention, redemption rates, or tier progression?
Your Survey Is a Churn Prevention Machine
A customer loyalty survey isn't a data collection exercise. It's your early warning system for identifying at-risk customers before they leave and your roadmap for fixing the issues that push them away.
The formula is clear: NPS reveals who's loyal, CSAT identifies where experiences break down, CES exposes hidden friction, and closing the loop turns all three into retention actions. The brands that win at retention aren't the ones with the most data. They're the ones that act on it fastest.
Start with one quarterly NPS survey. Add trigger-based CSAT and CES surveys at your highest-impact touchpoints. If you haven't built your loyalty program yet, that's the foundation these survey insights plug into. Build your response playbooks for each segment. Then track the movement. Detractors becoming Passives. Passives becoming Promoters. That progression is the only metric that proves your survey program works.
Ready to connect your survey insights with automated retention actions? Explore how Joy Loyalty integrates customer feedback with your loyalty program, from NPS tracking to tier-based interventions that act on every response.
Frequently Asked Questions
What is a customer loyalty survey?
It's a structured feedback tool that measures how likely customers are to keep buying from your brand and recommend it to others. Typically uses NPS, CSAT, and CES to quantify loyalty and identify at-risk customers before they churn. Think of it as a diagnostic tool that reveals what your sales data alone cannot.
How often should you send customer loyalty surveys?
Three to four surveys per customer per year hits the sweet spot. Use trigger-based surveys after key moments like purchases and support interactions, and schedule periodic NPS check-ins quarterly or biannually. Higher purchase frequency means less frequent surveys, because behavioral data fills the gaps.
What's a good NPS score?
NPS ranges from negative 100 to positive 100. Above 0 is acceptable, above 30 is considered good, and above 70 is excellent. But the trend matters more than the absolute number. A declining NPS signals churn risk regardless of where you start, and a rising NPS confirms your retention efforts are working.
What's the difference between NPS, CSAT, and CES?
NPS measures overall loyalty through the "likelihood to recommend" question. CSAT measures satisfaction with a specific interaction or touchpoint. CES measures how much effort a customer needed to complete a task or resolve an issue. Use all three together for a complete picture of churn risk rather than relying on any single metric.
How many questions should a loyalty survey have?
Three to five core questions plus one optional open-ended question. The entire survey should take under five minutes. Shorter surveys consistently produce higher completion rates and better quality responses, because respondents invest genuine thought rather than rushing to finish.
How do you increase survey response rates?
Offer loyalty points or a small discount for completion. Send surveys at the right moment, within 24 to 72 hours of the relevant interaction. Keep them short and mobile-friendly. Personalize the invitation with the customer's name and context about their recent experience. These four factors combined can push response rates well above 30%, compared to single-digit rates from cold, unsolicited surveys.
What should you do with negative survey feedback?
Act fast. Contact Detractors (NPS 0 to 6) within 24 to 48 hours with personal outreach from a real team member. Acknowledge their specific complaint, offer a concrete fix, and follow up in two to three weeks. If 20% or more of respondents cite the same issue, treat it as a systemic problem requiring a structural solution.
How do loyalty programs connect to customer surveys?
Survey data identifies at-risk customers, and your loyalty program gives you the tools to respond. Use survey insights to trigger tier upgrades for Passives, referral invitations for Promoters, and recovery offers for Detractors. The most effective programs automate these connections so responses happen within hours, not weeks.
Can small businesses benefit from loyalty surveys?
Absolutely. Even a simple quarterly NPS survey with one follow-up question reveals churn patterns that would otherwise stay invisible. Smaller businesses actually have an advantage: they can respond personally and faster than large brands, which increases win-back success rates significantly.
What's the biggest mistake brands make with loyalty surveys?
Collecting data and not acting on it. The survey itself doesn't prevent churn. The response does. Before you launch any survey, build a clear playbook for each NPS segment with specific actions, owners, and timelines. If you're not ready to act on the results, you're not ready to survey.
Related reading
-4b0e2f.webp&w=3840&q=75) How-to Guide
How-to GuideReferral Partner Program: A 6-Step Guide to Real Revenue
A practical guide to building a referral partner program: how it differs from customer referrals, a 6-step setup, commission models, the metrics that matter, and why most stall.
Thomas Nguyen-d82615.webp&w=3840&q=75) How-to Guide
How-to GuideB2B Referral Program: How to Build One That Drives Revenue
Most B2B brands already get referrals by accident. Here’s how to turn them into a system: readiness checks, a 5-step build, and why most programs stall.
Thomas Nguyen How-to Guide
How to Measure Brand Loyalty: 6 Critical Metrics for 2026
Likes don't equal loyalty - and neither do single-purchase sales. This guide breaks down how to measure brand loyalty with 6 critical metrics: LTV, repeat purchase rate, retention rate, point redemption, NPS, and UGC. Plus benchmarks for 2026 - when acquisition costs are 4× higher.
Thomas Nguyen