
The Real Cost of a Loyalty Point: What Real Shopify Programs Reveal
Calculate effective cashback, expected redemption cost, and loyalty liability using observed Shopify program designs and clear caveats.

Summarize this post with AI
A point has no meaningful cost on its own. Its cost comes from the earn rate, the value available at redemption, the share of points that customers redeem, and the contribution margin of the order where they use them.
The fastest way to audit a points program is to convert it into effective cashback. Then separate nominal customer value from expected realized cost. This makes programs with different currencies comparable and exposes expensive tier multipliers or stacking rules.
Observed Shopify programs also show why a generic “one point per dollar” benchmark is useless. One point can be worth one cent, half a cent, or something else. You need both sides of the exchange rate.
Key takeaways
- Effective cashback combines earn rate and point value.
- Nominal cashback is not the same as realized merchant cost.
- Redemption, returns, stacking, and margin change the result.
- Tier multipliers can make top-tier economics very different from base-tier economics.
- Program benchmarks need sample and collection-method caveats.
Start with the only comparable rate
Use this formula:
effective cashback = points earned per $1 × dollar value per point
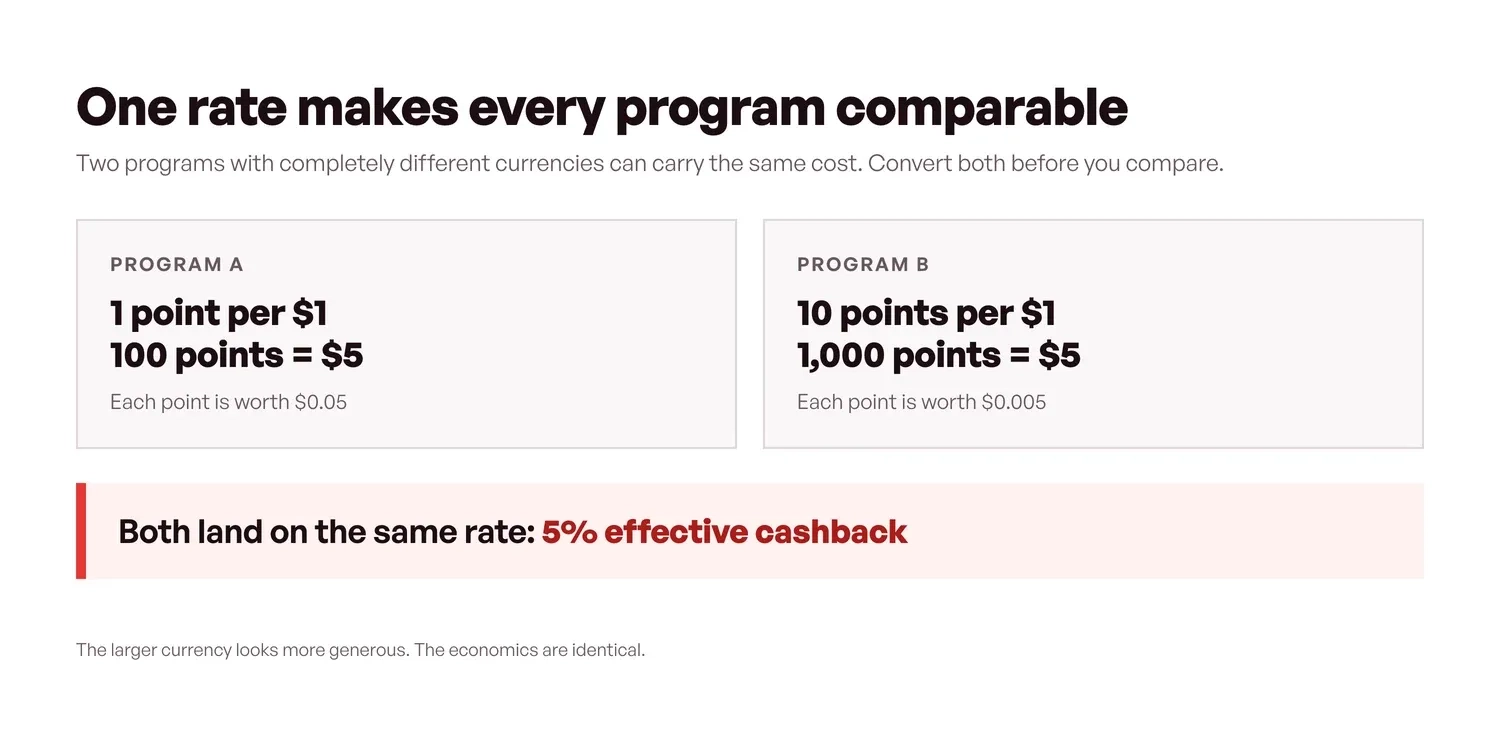
If customers earn one point per dollar and 100 points unlock $5, each point is worth $0.05. The effective cashback rate is 5%.
If customers earn ten points per dollar and 1,000 points unlock $5, each point is worth $0.005. The effective cashback rate is still 5%.
The larger currency looks more generous, but the economics are identical. This is why earn rate without redemption value cannot tell an operator anything useful about program generosity.
For product rewards, estimate a cash-equivalent value and a merchant-cost view separately. A product that retails for $30 may cost the merchant much less to source, but it still carries fulfillment, shipping, and inventory costs. Do not replace the retail value with COGS in customer-facing communication. Do use actual expected cost in the business model.
What observed Shopify programs show
A 2026 storefront research project combined a crawl of roughly 95 Shopify DTC storefronts with a second pass through brands named by loyalty vendors. Forty-one brands had readable rewards pages. Seventeen published both the earn rate and enough redemption information to calculate effective cashback for the entry tier.
In that set of 17 programs, nominal effective cashback ranged from 2% to 10%, with a median of 5%. Beauty and apparel each had a 5% median in the observed sample. Health and wellness programs were around 2% to 3%. Several categories had no complete observations at all.
These figures are observations, not industry benchmarks. The sample was not random. It leaned toward mid-market DTC brands in the US, Australia, and Europe, and many storefronts were blocked by JavaScript during the original crawl. Brands that publish a readable rewards page may differ from brands that do not. The category sample sizes were also small.
The useful conclusion is narrow: real Shopify programs vary widely, and a 5% nominal base rate appeared often in the readable sample. The data does not prove that 5% is optimal for a specific store.
The same research found tier multipliers between 1.25 times and 3 times in the observed programs. That can push a 5% base program to 6.25%, 10%, or even 15% nominal cashback for higher tiers. A tier model therefore needs a separate cost forecast for each member segment.
Nominal value is only the first layer of cost
If a program issues $100,000 of nominal point value, the merchant does not necessarily incur $100,000 of realized discount cost in the same period.
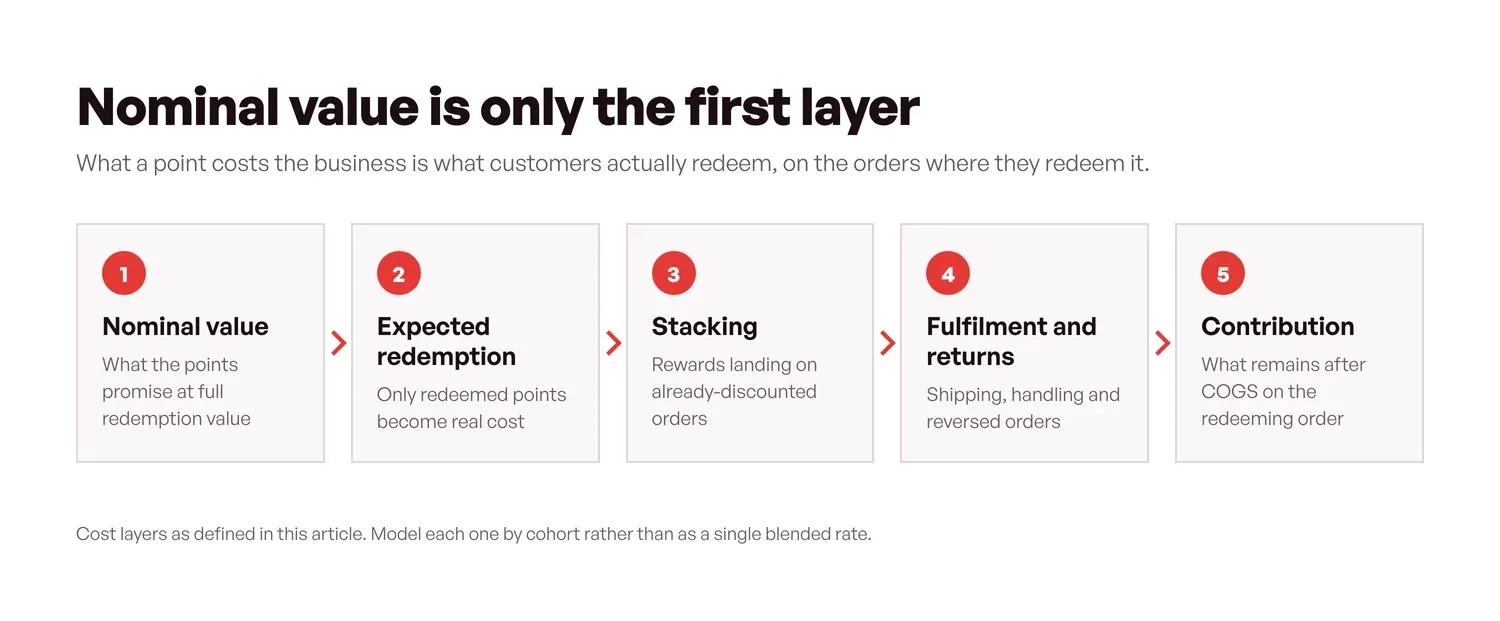
Some points remain unused. Some expire under the program terms. Some are reversed after returns. Others are redeemed on an order with enough incremental contribution to offset part of the incentive.
A simple planning estimate is:
expected redeemed value = points outstanding × dollar value per point × expected redemption rate
This is useful for forecasting, but it is not a complete contribution model or an accounting policy. Add the economics of redemption orders:
redemption-order contribution = net sales - COGS - fulfillment - payment cost - shipping subsidy - redeemed value - other discounts
Then include returns, cancellations, and reward fulfillment costs.
Do not assume unused points are pure profit. Low redemption may mean customers cannot reach a reward, do not understand the program, or cannot find eligible products. A cheap program that produces no behavior change is still wasteful.
Finance should own the revenue-recognition and liability policy. Under IFRS 15 and ASC 606, loyalty awards may create a performance obligation, and expected breakage can affect recognition. The exact treatment depends on program terms and applicable standards. Marketing dashboards should not be used as the accounting subledger.
Four design choices move cost quickly
Earn basis
Decide whether customers earn on gross merchandise value, net merchandise value, or the amount paid after discounts. Exclude taxes, shipping, gift cards, and refunded amounts where appropriate and clearly disclosed.
Awarding points on pre-discount value while allowing a discount on the same order increases generosity. It may be intentional, but it should not be accidental.
Redemption ladder
A flat point value is easier to understand and model. If 100 points always equals $5, customers and operators can calculate value quickly.
A ladder with better value at higher redemption levels can encourage saving, but it changes liability and may delay the first successful redemption. Model the customer distribution across every level, not just the cheapest reward.
Tier multipliers
A 2-times multiplier doubles nominal earn value. Yet high-tier members may already buy frequently. Paying the highest rate to customers selected by high spend can fund behavior that would have happened anyway.
Estimate cost by tier, and test whether the multiplier changes incremental purchase behavior. A top-tier-versus-base-tier comparison does not answer that question because spend is often the qualification rule.
Stacking and caps
Points can interact with subscriptions, bundles, automatic discounts, free shipping, and sale prices. One order may carry several incentives.
Set explicit rules for:
- Maximum redeemed value per order.
- Minimum spend after redemption.
- Discount-code compatibility.
- Subscription and bundle eligibility.
- Product and collection exclusions.
- Partial and full refund reversals.
A cap is a merchant policy, not an industry benchmark. Choose it from contribution-margin tolerance and customer clarity.
Build a program cost model by cohort
A single redemption-rate assumption hides important differences. New members, active repeat buyers, VIPs, and dormant members do not earn and redeem in the same way.
Create a cohort table with:
- Members entering the cohort.
- Eligible spend.
- Points issued and reversed.
- Nominal dollar value issued.
- Points redeemed.
- Redemption-order revenue.
- Other discounts on those orders.
- Gross margin and contribution margin.
- Outstanding point value at period end.
- Expired or otherwise removed value.
Keep three rates distinct:
- Point redemption rate: points redeemed divided by an explicitly defined point base.
- Reward redemption rate: rewards used divided by rewards issued or claimed, with the denominator stated.
- Member redemption rate: members who redeemed divided by eligible or active members, again with the denominator stated.
These are not interchangeable. A public benchmark based on rewards redeemed cannot validate a dashboard based on points redeemed.
For a pre-launch forecast, model a low, base, and high redemption scenario. For an existing program, use the store’s own cohort history. Recent behavior is usually more decision-relevant than a vendor average drawn from different merchants.
Treat breakage as an estimate, not a target
Breakage is the portion of issued value expected not to be redeemed. It can reduce expected cost, but aggressive expiration can also change customer behavior and trust.
Estimate breakage using mature cohorts. A newly issued point balance has not had enough time to redeem, so counting it as breakage overstates the unused share. Match the observation window to the expiration and natural purchase cycle.
When terms change, keep old and new cohorts separate. Shortening expiration may reduce outstanding liability while also increasing reminders, redemptions, support contacts, or churn. A before-and-after result mixes all of those effects unless the measurement design separates them.
Price the behavior, not the point
The right question is not “What should one point be worth?” It is “What effective reward rate can this store fund for the behavior it wants?”
Translate the currency into effective cashback. Forecast realized cost by cohort and tier. Add stacking, fulfillment, returns, and shipping. Then compare the total cost with incremental contribution, not attributed revenue.
A point system is easy to configure and hard to price well. The program becomes manageable when every point can be traced from issuance through redemption, reversal, expiry, and contribution.
Sources
- IFRS 15: Revenue from Contracts with Customers
- FASB: Revenue recognition implementation resources
- Joy original storefront research, collected September 2 and September 15, 2026: approximately 95 Shopify DTC storefronts; 41 readable rewards pages; 17 programs with calculable entry-tier effective cashback. Non-random sample with category and rendering limitations.

Written by
Thomas Nguyen is the CEO & Co-founder of Joy, a loyalty solution for Shopify and eCommerce brands. With years of experience building high-performance Shopify apps, Thomas aims to help merchants grow through customizable and retention-focused tools.
Related reading
 Loyalty Strategy
Customer Retention Goals: 5 Targets to Set (and How to Hit Them)
A goal-first guide to customer retention: the five targets worth setting, how to make each one SMART, and the strategy that hits it.
 Thomas Nguyen
 Loyalty Strategy
Double Points at BFCM: What a 2x Weekend Costs in Margin
A 2x weekend on a discounted order can take 10% of its gross margin. The full arithmetic, with every assumption printed.
Thomas Nguyen Loyalty Strategy
Customer retention benchmarks for ecommerce: What's a good rate?
A clear-eyed look at ecommerce retention benchmarks: the one number worth trusting, why most by-industry tables mislead, and how to benchmark against yourself.
Thomas Nguyen Loyalty Strategy
Customer Retention Analytics: Turn Your Data Into Retention Action
Most retention guides stop at the numbers. This one shows how to read your retention data and turn each metric into a concrete loyalty play for your Shopify store.
Thomas Nguyen Loyalty Strategy
When a Referral Program Beats a Points Program
Use product cadence, advocacy, margin, and fraud risk to decide when referrals should lead your retention strategy instead of points.
Thomas Nguyen Loyalty Strategy
How to set up customer retention automation (without a big team)
A step-by-step guide to automating customer retention across the customer lifecycle, from onboarding to win-back.
Thomas Nguyen