Customer retention benchmarks for ecommerce: What's a good rate?
A clear-eyed look at ecommerce retention benchmarks: the one number worth trusting, why most by-industry tables mislead, and how to benchmark against yourself.
Updated

Summarize this post with AI
Search for customer retention benchmarks, and you'll find a dozen tidy tables: beauty at 28 percent, apparel at 22, subscription at 84. They look authoritative. The problem is that most of them trace back to the same handful of older datasets, repackaged year after year without a source you can check.
So this guide does something different. It gives you one benchmark you can actually trust, shows you how to calculate your own rate, and explains why comparing yourself to an industry average is the wrong move anyway. The goal isn't a prettier table. It's a number you can stand behind.
Key takeaways
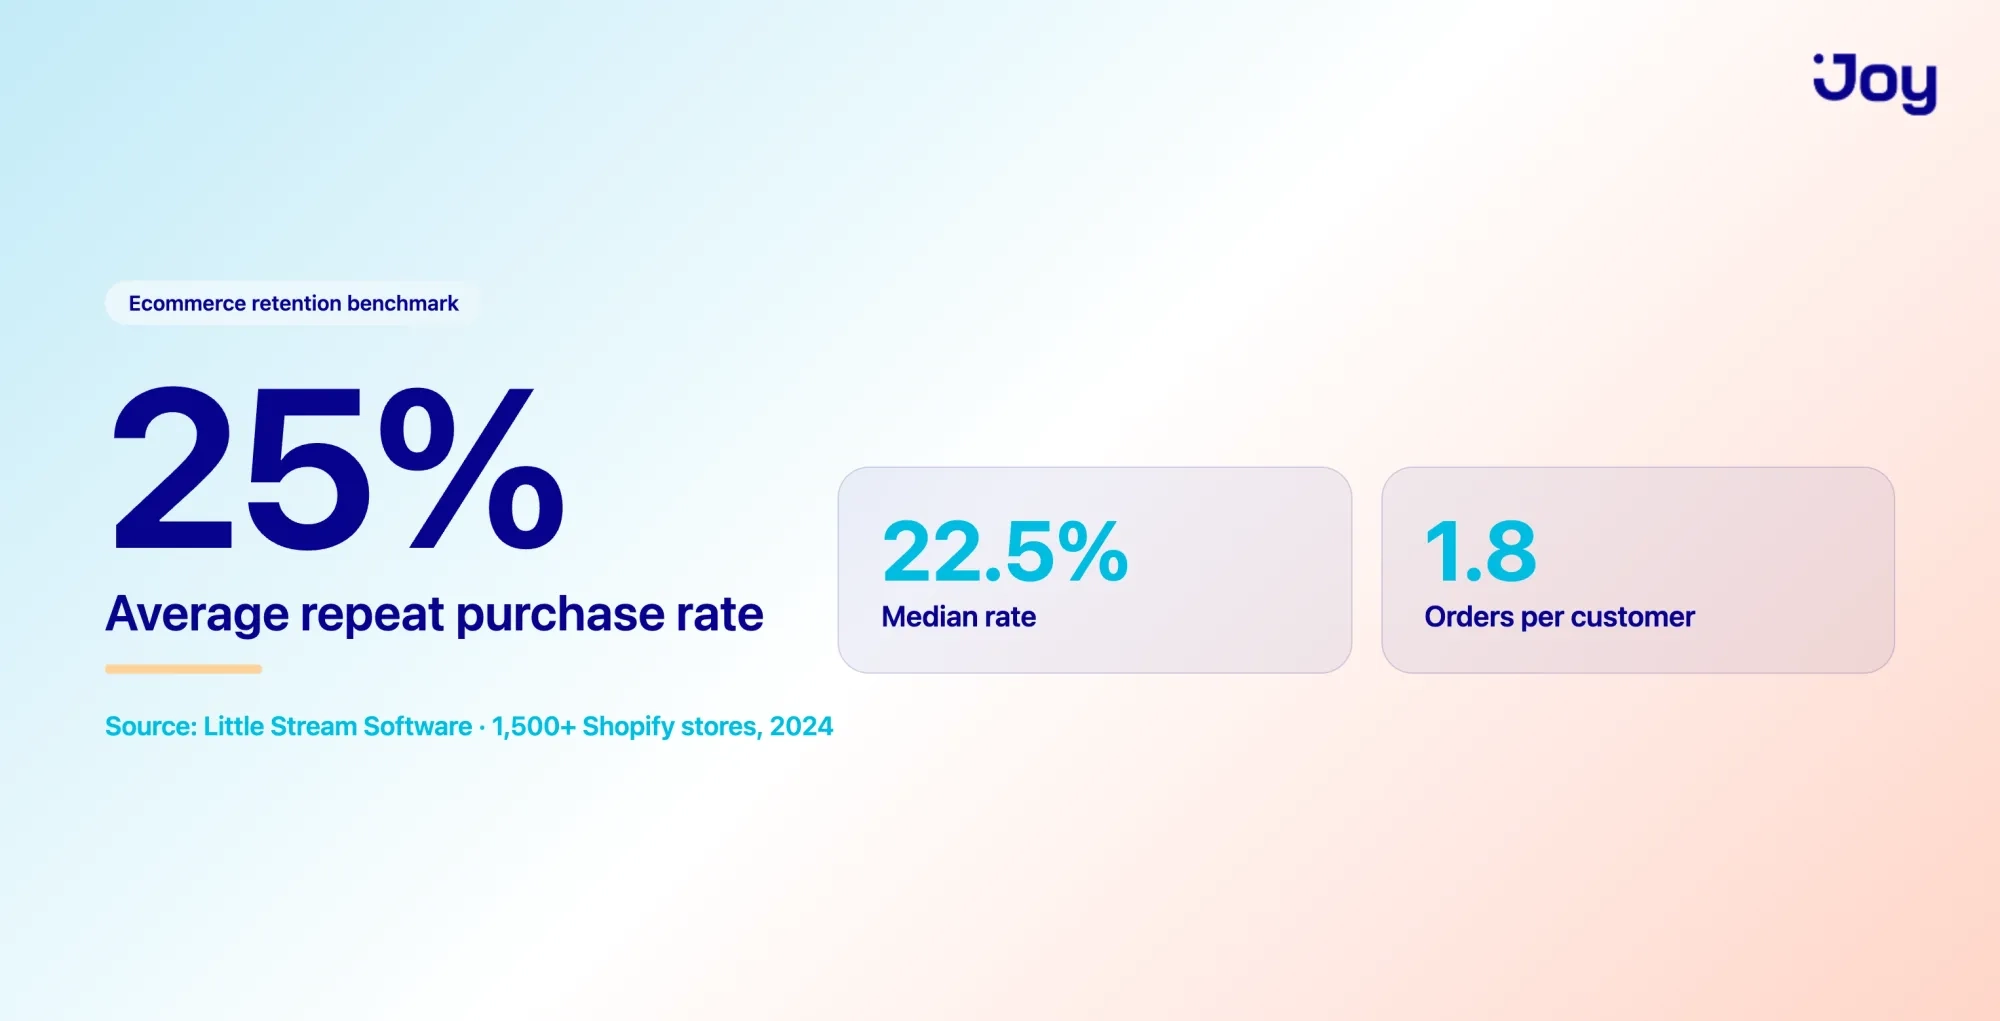
- The most reliable recent benchmark for ecommerce is a repeat purchase rate of around 25 percent, based on real Shopify store data from 2024.
- Retention rate and repeat purchase rate measure different things. Mixing them up is the main reason published benchmarks contradict each other.
- Retention varies widely by category, but most published tables hide their year and sample size, so weigh any number against how the source was built.
- Purchase frequency, not your industry label, drives most of the gap between high and low retention numbers.
- The benchmark that matters most is your own rate, tracked over time. Beating last quarter beats matching a stranger's average.
How to calculate your customer retention rate
Before comparing anything, you need a number to compare. Customer retention rate is the share of customers you keep over a set period, and the formula is straightforward:
Retention rate = ((E − N) / S) × 100
Where S is the number of customers you started the period with, E is the number of customers you ended with, and N is the number of new customers you gained during it. Say you began the quarter with 500 customers, ended with 480, and added 120 new ones along the way. That's ((480 − 120) / 500) × 100, or a 72 percent retention rate.
One thing trips people up here, and it's worth pausing on because it explains why benchmarks often disagree.
Retention rate vs repeat purchase rate vs churn
These three numbers get used interchangeably, but they aren't the same:
- Customer retention rate measures how many customers you keep over a period, as above. It suits businesses where customers are expected to keep coming back regularly.
- Repeat purchase rate measures the share of customers who have made repeat purchases. A store with 1,000 customers and 250 who have ordered twice or more has a 25% repeat purchase rate. This is often the cleaner metric for one-off product sales.
- Churn rate is the flip side of retention: the share of customers you lost over the period.
When one article reports ecommerce retention at 30 percent and another at 70 percent, they're usually measuring different things on different timeframes. Keep that in mind for everything below.
What's a good retention rate for an online store?
Here's the most trustworthy recent figure we found. A 2024 analysis of more than 1,500 real Shopify stores by Little Stream Software put the average repeat purchase rate at 25 percent, with a median of 22.5 percent and an average of 1.8 orders per customer. The study used aggregated, non-personal data and spelled out its method, which is more than most benchmark tables can say.
So a quarter of customers buying again is roughly the middle of the pack for a Shopify store. If you're sitting well below that, there's room to work. If you're comfortably above it, your retention efforts are already doing their job.
Treat that 25 percent as a sanity check, not a target carved in stone. The right number for your store depends heavily on what you sell, so it helps to look at the picture by category.
Customer retention benchmarks by category
Different categories keep customers at very different rates, so a single average only takes you so far. Here's a breakdown of categories from Decile's Ecommerce Benchmarking Guide, drawn from brands on its platform.
One caveat worth stating up front: this is 2023 data, and Decile didn't publish its sample size. So read the table as a rough map of how categories rank against each other, not as a precise score to grade yourself on.
| Category | Repeat purchase rate | Retention rate | Purchase frequency | AOV |
|---|---|---|---|---|
| Health & Beauty | 35% | 21% | 2.2 | $100 |
| Food & Beverage | 34% | 23% | 2.3 | $65 |
| Fashion & Apparel | 30% | 19% | 1.6 | $125 |
| Home Goods | 20% | 12% | 1.3 | $175 |
Look at how the columns move together. The categories with the highest repeat purchase and retention rates, food and beauty, are also the ones with the highest purchase frequency. That last column is the real story.
Frequency drives the gap, not the category name
A coffee or supplements brand sells something customers finish and reorder every few weeks. A furniture or electronics store sells something customers might buy once every few years. Of course their retention numbers look different, and no amount of loyalty work fully closes that gap, because it's baked into the product.
That's why a 20 percent repeat rate could be excellent for a high-ticket, low-frequency store and disappointing for a consumables brand. Comparing yourself to a broad "ecommerce average" flattens all of that. The more useful comparison isn't your industry. It's you.
Benchmark against yourself, not the industry
The benchmark that actually tells you something is your own rate, measured the same way, period after period. An average from a stranger's dataset can't account for your products, prices, or customers. Your own trend line can.
A practical way to do this is by cohort: group customers by the month they first bought, then track the share of each group that comes back over the following months. When your March cohort retains better than your January cohort, you know something you changed is working. Our guide on the retention curve walks through how to read those patterns.
This reframes the whole question. Instead of "Is 25 percent good", you're asking "Are we keeping more customers than we did last quarter" That's a question you can act on, and it doesn't depend on anyone else's benchmark being accurate.
How to close the gap on your own benchmark
Once you're tracking your rate honestly, the next question is how to move it. Most of the difference between a store whose repeat purchase rate sits near 20 percent and one closer to 40 percent comes down to what happens after the first order. The high performers make the second purchase feel natural, with timely post-purchase follow-up and a reason to come back, while the rest leave it to chance.
That follow-up is hard to keep up with by hand as orders grow, which is why most of it works better on autopilot. Our guide on customer retention automation covers the specific flows worth setting up, from onboarding to win-back. A loyalty program sits at the center of that work, since every order earns a reason to place the next one. If you want the economics behind it, our piece on loyalty program retention rate breaks it down.
Whatever you set up, measure it against your own baseline rather than a borrowed average. Joy reports on retention rate, repeat purchase rate, and customer lifetime value in the app, so you can watch your trend line move without exporting data to a spreadsheet every month.
Stop chasing the average
A retention benchmark is a starting point for a conversation, not a grade on a report card. The single most reliable recent figure, a 25 percent repeat purchase rate for Shopify stores, is useful for one thing: a quick gut check on roughly where you stand.
After that, the average stops mattering. What moves the business is your own rate, tracked over time and nudged upward with steady post-purchase follow-up. If you want to start measuring and improving it in one place, you can try Joy Loyalty for free and watch your repeat purchase rate in the dashboard as you go.
Frequently asked questions
What's a good customer retention rate for an online store?
A repeat purchase rate around 25 percent is roughly average for Shopify stores, based on 2024 data from over 1,500 stores. Anything well above that is strong, but the right target depends on how often your products are naturally rebought.
How is retention rate different from repeat purchase rate?
Retention rate measures how many customers you keep over a set period. Repeat purchase rate measures the share of customers who have ever bought more than once. They often produce very different numbers, which is why published benchmarks so often disagree.
Why is my ecommerce retention lower than the SaaS benchmarks I see?
SaaS runs on subscriptions, so retention compounds month over month and naturally looks high. Most e-commerce sites sell one-off products that people rebuy on their own schedule, so comparing the two isn't fair to your store. Compare against ecommerce data, and ideally against your own history.
Where do most retention benchmark tables get their numbers?
Many trace back to the same older datasets, repackaged without a clear year or sample size. The category table above comes from Decile's 2023 guide, and we've flagged the year on purpose so you can weigh it for what it is, rather than treat it as current gospel.
Related reading
 Loyalty Strategy
Customer Retention Goals: 5 Targets to Set (and How to Hit Them)
A goal-first guide to customer retention: the five targets worth setting, how to make each one SMART, and the strategy that hits it.
Thomas Nguyen Loyalty Strategy
How to set up customer retention automation (without a big team)
A step-by-step guide to automating customer retention across the customer lifecycle, from onboarding to win-back.
Thomas Nguyen Loyalty Strategy
Customer Retention Analytics: Turn Your Data Into Retention Action
Most retention guides stop at the numbers. This one shows how to read your retention data and turn each metric into a concrete loyalty play for your Shopify store.
Thomas Nguyen