
Repeat Customer Rate: Formula, Benchmarks, and What Good Looks Like
Two formulas, one worked example, Bluecore's published benchmarks, and the exact place in your Shopify admin where repeat customer rate already lives.

Summarize this post with AI
Most stores do not have a retention problem they can see. They have a retention number they have never calculated.
Repeat customer rate is that number. It is the share of your buyers who came back. It sets your ceiling on customer lifetime value, it decides how much you can afford to pay for a new customer, and it is the first thing an investor or an agency asks for. This guide gives you the formula, a worked example, named benchmarks to compare against, and the exact place in your Shopify admin where the number already lives.
Key Takeaways
- Repeat customer rate is the share of your buyers who have ordered more than once. It is the clearest single read on whether your store compounds or resets every month.
- There are two formulas and they disagree. The cohort formula answers “did my new buyers come back?” Shopify’s returning customer rate answers “how much of this period’s demand came from people who already knew us?”
- Shopify’s version moves when you change acquisition spend, even if retention never changed. Know which question you are asking before you read the number.
- Across 100+ retailers in seven verticals, Bluecore’s 2024 report put the average repeat purchase rate — the share of first-time buyers who made a second purchase — at 16.5% for 2023, and found 74% of customers are one-and-done.
- Track the first-to-second-order gap alongside the rate. The rate tells you how many came back; the gap tells you how long you have to make it happen.
What Counts as a Repeat Customer

A repeat customer is someone whose order history with you includes more than one order. Shopify uses the same definition, and it matters that you use Shopify's, because that is the definition baked into the reports you will be reading: a returning customer is “a customer who placed an order, and whose order history already includes at least one order.” (Shopify Help Center, Customers reports, accessed September 2026.)
Two things follow from that, and both are worth more than a list of adjectives about loyalty:
The second order is the hard one. Bluecore's 2024 Customer Growth Benchmarks Report — built on the full 2023 calendar year across more than 100 retailers in seven verticals — found that 74% of a retailer's customers are one-and-done. That is the wall this metric measures.
Repeat buyers are worth more per head. The same report found that active buyers placed 57.6% more orders and spent 69.2% more than new buyers. You are not trying to build a habit across your whole list. You are trying to get one order past a single threshold.
Why this is worth your margin: research by Bain & Company, published in Harvard Business Review in 2014, found a 5% increase in customer retention can raise profits by 25% to 95%.
If your number is low and you want the diagnosis rather than the measurement, start with why customers don't return.
The Two Formulas (And Why Yours Disagree)
Formula 1 — Cohort repeat purchase rate
This answers: of the people who bought from me for the first time, how many came back?
Repeat purchase rate = (first-time buyers in the period who bought again) ÷ (first-time buyers in the period) × 100
This is the definition Bluecore uses in its benchmarks — “the percentage of first-time buyers who made a second purchase” — so it is the one to use when you want to compare yourself with anybody else.
Formula 2 — Shopify's returning customer rate
This answers: how much of this period's demand came from people who already knew us?
Returning customer rate = returning customers ÷ customers
That is Shopify's own formula, published in its Analytics data points (fields) reference, where the metric is defined as the “percentage of returning customers relative to all customers who placed orders.” Both sides of it are scoped to the date range you have selected. (Shopify Help Center, accessed September 2026.)
A worked example
Illustrative store, not a Joy customer. The figures are constructed to show the mechanics.
| Northlake Supply, 1 January – 31 December | Value |
|---|---|
| Customers who placed at least one order | 4,180 |
| Of those, customers whose history already included an order | 712 |
| First-time buyers, 1 Jan – 30 Jun | 2,950 |
| Of those, bought again by 31 Dec | 487 |
Shopify returning customer rate = 712 ÷ 4,180 = 17.0%
Cohort repeat purchase rate = 487 ÷ 2,950 = 16.5%
Close, in a stable year. They come apart the moment the year stops being stable.
The volume trap
This is the failure mode nobody warns merchants about, and it is the reason both formulas exist.
| Month A | Month B | |
|---|---|---|
| Customers who ordered | 300 | 700 |
| Of those, returning | 60 | 70 |
| Returning customer rate | 20.0% | 10.0% |
In Month B the store ran a paid acquisition push. More repeat customers bought — 60 became 70 — and the rate halved. Nothing about retention got worse. The denominator got bigger.
So: use the cohort formula to judge retention and to benchmark. Use Shopify's returning customer rate to judge revenue mix. Reading the second as if it were the first is how teams talk themselves into killing a loyalty program that was working.
Where to Read This Number in Shopify
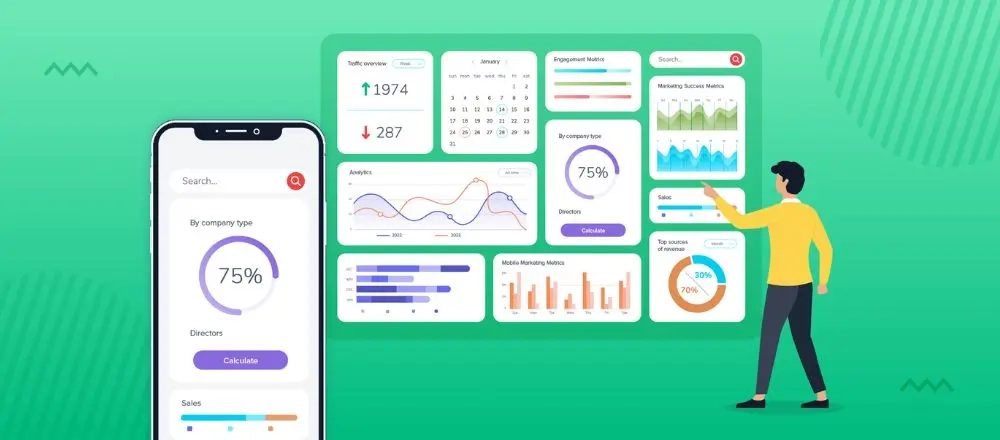
You do not need another tool to start. The number lives in two places in your Shopify admin, and they are not the same view:
- Analytics → Overview. Returning customer rate sits in the Sales group of insights, alongside gross sales, net sales, orders and average order value. This is Formula 2, scoped to the date range you have selected — which is exactly where the volume trap bites.
- Analytics → Reports → Category filter → Customers. Here it is a reporting field rather than a headline. Four reports matter: New vs returning customers (“the number of first-time and returning customers for a given period of time”), Returning customers (“all your customers whose order history includes two or more orders”), One-time customers (“all your customers whose order history includes only one order”), and Customer cohort analysis, the only native place to see retention by acquisition month.
What Shopify does not give you: a cohort repeat purchase rate on a fixed window (Formula 1), or the time between first and second order. Both have to be built from the cohort report or pulled from your loyalty or analytics platform.
And do not read your Shopify number straight against the benchmarks below. Three different measurements are in play. Shopify's returning customer rate counts everyone who ordered inside your chosen date range. Bluecore's repeat purchase rate counts only first-time buyers who came back for a second order. Bluecore's retention rate counts customers from the prior year who kept buying. Three denominators, three answers — compare like with like, or do not compare.
For what to do with the data once you have it, see customer retention analytics.
Benchmarks: What Everyone Else Is Doing
Two tables below. They come from two editions of the same report, and they measure two different things in two different years. Read each on its own terms — there is no trend line running between them, and the vertical lists do not match either. Bluecore dropped toys and gifts and added department stores between the two editions.
Repeat purchase rate — the share of first-time buyers who made a second purchase, 2023 data. Source: Bluecore, 2024 Customer Growth Benchmarks Report (archived copy), covering the full 2023 calendar year across more than 100 retailers in seven verticals. The report presents most vertical-level results as charts; the figures below are the ones Bluecore published as numbers, in its announcement of 16 April 2024.
| Vertical | Repeat purchase rate, 2023 |
|---|---|
| All verticals (average) | 16.5% |
| Health and beauty | 21.5% |
| Sporting goods and outdoor | 21.2% |
| Apparel | 20.2% |
The other three verticals in that edition — footwear, home goods, and jewelry and luxury — were published as charts with no figure in the text. They are left out rather than estimated.
The long view, same report. Bluecore models survivorship from a base of 100 first-year buyers: 16.5 of them buy again in year two, and just 6 are still buying in year three. Repeat customers are not a state you reach. They are a position you hold.
Customer retention rate — the share of the prior year's customers who kept buying, 2024 data. A different metric and a different year from the table above, so do not read one against the other. Source: Bluecore, 2025 Customer Growth Benchmarks Report, covering the full 2024 calendar year across more than 100 retailers in seven verticals, as reported by Shopify in “Average Customer Retention Rates by Industry”, updated 4 September 2026.
| Vertical | Retention rate, 2024 |
|---|---|
| All verticals | 27.4% |
| Health and beauty | 41.2% |
| Department stores | 36.2% |
| Apparel | 31.7% |
| Sports and hobbies | 27.8% |
| Footwear | 22.2% |
| Home goods | 21.4% |
| Jewelry and accessories | 19.1% |
One seasonal number worth knowing. Analyzing BFCM 2022 across $31.7m of revenue and 294,869 orders, Tresl found only 13% of the new customers acquired that weekend returned to shop again. Discount-acquired cohorts repeat worse than the average — plan for it before you budget the discount. Full breakdown: customer retention benchmarks.
Score Yourself
This band is a practical guide, not a published benchmark. It is anchored on the two figures Bluecore did publish for 2023: a 16.5% cross-vertical average repeat purchase rate and a 21.5% ceiling in the strongest vertical. Treat it as a way to read your own number, not as an industry standard.
| Your cohort repeat purchase rate | Read |
|---|---|
| Under 10% | Poor. Growth is entirely rented. Every flat month in ad spend is a flat month in revenue. |
| 10–16% | Below the cross-vertical average. There is a specific leak; find it before you spend more on acquisition. |
| 17–21% | At or above average, and inside the range Bluecore's strongest verticals reported for 2023. |
| Over 22% | Strong for a considered-purchase catalogue. If you sell consumables or replenishables, expect to clear this and keep pushing. |
Two adjustments before you judge yourself. If you sell consumables, expect to sit above these bands — Bluecore's strongest vertical for 2023 was health and beauty, which deals in products that need replenishing. If you sell high-ticket or once-a-decade goods, expect to sit below them — jewelry and luxury had the lowest repeat purchase rate of the seven verticals in that edition, while those customers spent far more per head. Benchmark against your vertical first, then against your own last quarter.
The Companion Metric: Your First-to-Second-Order Gap
The rate tells you how many came back. It does not tell you how long you had to make it happen, and that is the number your campaign calendar actually needs.
First-to-second-order gap = median days between a customer's first order and their second
Use the median, not the mean. A handful of customers who return after two years will drag a mean into uselessness. Build it from Shopify's cohort report or your loyalty platform, then use it directly: if your median gap is 34 days, a win-back email at day 60 is a eulogy, not a campaign.
We are not publishing a benchmark for this. The numbers circulating for “average days to second purchase” trace back to agency blog posts citing each other, with no named study, sample or year behind them. Measure your own, watch it move, and ignore anyone quoting a figure they cannot source.
Two metrics to read alongside it
- Customer lifetime value (CLV) = average order value × average purchase frequency × customer lifespan. Repeat customer rate is the input that moves CLV fastest.
- Churn rate = (customers lost ÷ customers at start of period) × 100. The mirror image. If repeat rate is rising and churn is rising too, you are winning a small core and losing the middle.
For the wider metric set, see how to measure customer loyalty.
Prove the Change Moved the Number
A repeat customer rate that changes after you ship something is not evidence that the thing worked. Isolate it:
- Test one variable at a time — reward structure, email timing, or offer, never all three.
- Measure on a cohort, not on the overview dashboard, or the volume trap will read your acquisition spend back to you as a retention result.
- Tools like Optimizely, VWO, or a Shopify A/B testing app can simplify running tests and analyzing results. Google Optimize is no longer an option — Google shut it down on 30 September 2023.
Your Number Is Low. Now What?

The playbook is not short, and it does not belong in a measurement guide. Joy's 7-step system covers the whole of it — auditing your baseline, choosing a program model, setting earning and redemption rules, removing friction, support, community, referrals, and the monthly optimization loop: how to enhance customer loyalty.
Three things are worth saying here, because they are measurement decisions rather than tactics:
- Fix the second order before anything else. With 74% of customers one-and-done in Bluecore's 2023 data, the entire compounding effect sits on a single transition. Aim your budget at it.
- Reactivation is cheaper than you think and rarer than it should be. Bluecore put the average reactivation rate at 6.6% for 2023 — 9.2% in health and beauty — while reactivated buyers ordered 7.7% more often and spent 12.7% more than new buyers.
- Protect your best customers. Across Bluecore's own customer base, 35% of sales come from the top quartile of customers. A repeat rate that rises while that quartile shrinks is not progress.
Measure It, Then Move It
Calculate both formulas this week. Write down the cohort number and your median first-to-second-order gap, and put a date on the next reading. A retention metric you check once is a statistic; one you check monthly is a system.
Joy is the loyalty platform for merchants who intend to move the number rather than admire it. More than 10,000 Shopify stores run their programs on Joy, and Joy measures itself the way it asks you to — on Assisted Orders, meaning orders placed through a referral link or with a loyalty-generated discount code, not on points issued or members enrolled. Levents has passed 100,000 assisted orders on that definition.

Written by
Thomas Nguyen is the CEO & Co-founder of Joy, a loyalty solution for Shopify and eCommerce brands. With years of experience building high-performance Shopify apps, Thomas aims to help merchants grow through customizable and retention-focused tools.
Related reading
 Loyalty Strategy
How to set up customer retention automation (without a big team)
A step-by-step guide to automating customer retention across the customer lifecycle, from onboarding to win-back.
 Thomas Nguyen
 Loyalty Strategy
Customer Retention Analytics: Turn Your Data Into Retention Action
Most retention guides stop at the numbers. This one shows how to read your retention data and turn each metric into a concrete loyalty play for your Shopify store.
Thomas Nguyen Loyalty Strategy
Advantages of Customer Loyalty: 7 Data-Backed Benefits for Ecommerce Growth
Customer loyalty isn't a feeling — it's a financial asset that compounds. A 5% retention bump drives 25–95% more profit; emotionally connected customers deliver 306% higher LTV. This guide covers all 7 data-backed advantages and the 3 mistakes that kill programs before the compounding kicks in.
Thomas Nguyen Loyalty Strategy
Customer retention benchmarks for ecommerce: What's a good rate?
A clear-eyed look at ecommerce retention benchmarks: the one number worth trusting, why most by-industry tables mislead, and how to benchmark against yourself.
Thomas Nguyen Loyalty Strategy
Customer Retention Goals: 5 Targets to Set (and How to Hit Them)
A goal-first guide to customer retention: the five targets worth setting, how to make each one SMART, and the strategy that hits it.
Thomas Nguyen Loyalty Strategy
Customer Retention Cost: Formula & Strategies to Optimize It
Customer retention is often cheaper than acquisition, but are you managing your costs effectively? Learn how to calculate retention costs and optimize your strategy without overspending.
Thomas Nguyen